Homework 1#
Overview#
About the data set#
This homework aims to give you hands-on experience in various essential data preprocessing techniques. Using the California Housing Dataset, you will practice calculating descriptive statistics, cleaning data, normalizing and discretizing data, visualizing distributions, and calculating dissimilarity matrices.
Objectives#
Practice calculating descriptive statistics, handling missing values, and detecting duplicates.
Learn how to normalize and discretize attributes.
Visualize data distributions using histograms, box plots, and scatter plots.
Compute dissimilarity matrices for nominal, ordinal, and mixed-type attributes.
The attributes in the dataset#
longitude: Longitude coordinate of the block where the house is located.
latitude: Latitude coordinate of the block where the house is located.
housingMedianAge: Median age of houses within a block (years).
totalRooms: Total number of rooms within a block.
totalBedrooms: Total number of bedrooms within a block.
population: Total population of a block.
households: Total number of households within a block.
medianIncome: Median income for households in the block (in tens of thousands of dollars).
medianHouseValue: Median house value for households in a block (in US dollars).
oceanProximity: Proximity of the block to the ocean.
Access and Submission#
Accept your instructor’s invitation to the Google classroom via this link.

After joining the classroom, you can begin your Homework through here.
Start your work by accessing the Colab file marked within the red box.
Once you’ve completed the homework, click “Turn in” to submit.
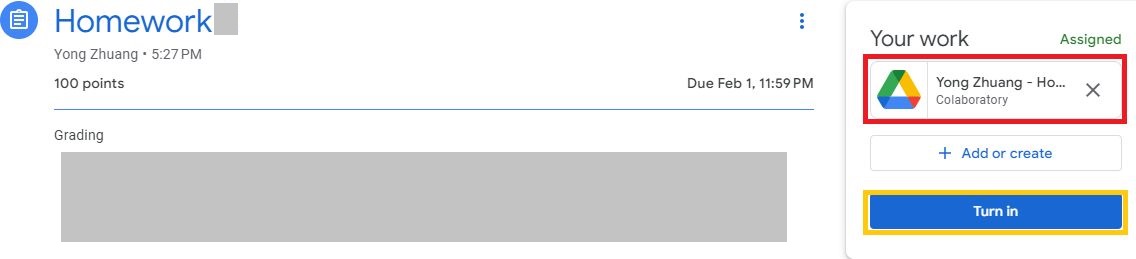
Note: You must ‘Turn in’ your notebook for this homework; otherwise, it will not be graded.